The Case for Speed Endurance
by Derek DeBarr
Twitter gives each coach an unprecedented glimpse into the eyes of other programs. At the swipe of a thumb, we can all wander into the seamlessly endless abyss of the greatest minds in the sport. As the circuitry allows us to jump into the fog, we notice patterns of greatness and precursors to success. It also allows us to pinpoint anomalies in our data sets and attempt chart a course to Atlantis. Personally, the numbers and trends that others were reporting on weren’t matching up with my own data. As I was treading the sea in my own mind, I noticed a rather different correlation; speed endurance tended to be a better predictor of success in sprint races (100/200/400) rather than a maximum fly 10 score, and timed runs from a stop were the best predictor of success
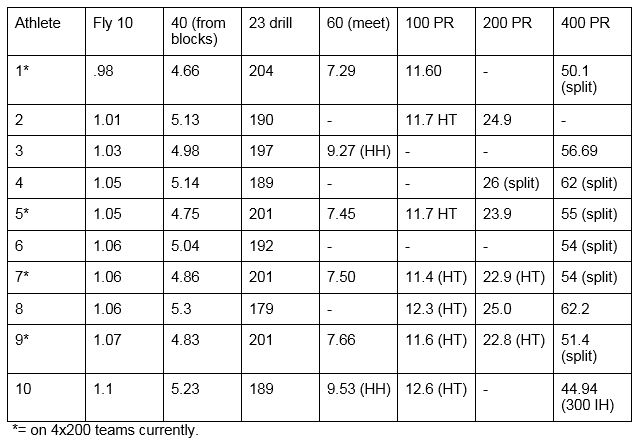
First, let’s analyze the data of the top 10 athletes on my team this year:

So, after looking at this data, the most obvious question is, what in the world is going on with my team? Currently our 4×200 has ran 1:35.81, good for #2 in Illinois 1A. Yet the athletes who are consistently the fastest in that distance rank 1, 4 (tied), 5 (tied), and 9th on the current list of the fastest fly 10s. Why? If the formula of max velocity being the best predictor of overall sprint ability is true, wouldn’t my 1-4 guys crush the field, and why is athlete #8 almost a full 20 meters behind my top dogs when his fly 10 insinuates he should be in the fight? Also, it should be noted that when athlete 5 and 7 raced head to head earlier this year in the 60, athlete 5 ran 7.59 and athlete 7 ran 7.50. Why? And why is athlete #9 ranked third in the 40 yard dash when his fly 10 suggests that he should be way back in the pack? After looking at a different set of data, the answer looked a bit clearer:

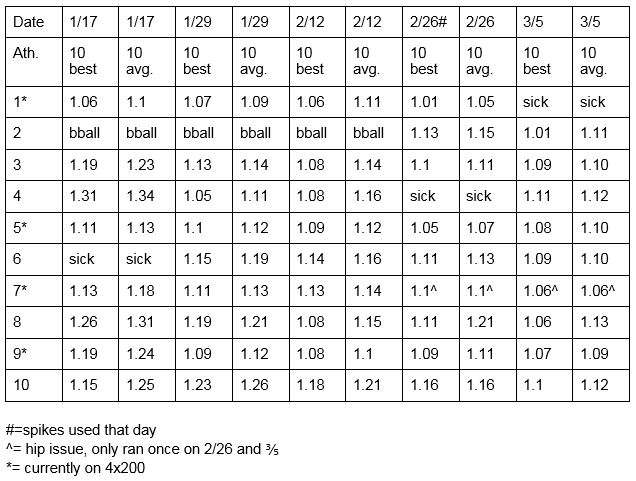
Looking at this chart, a couple of large factors jump out; namely, that some of these athletes have their overall best time missing. For whatever reason, January 22nd looked to be a good day. That’s when athletes numbered 2, 3, and 6 ran their huge PR’s that are rather large outliers on their normal data set. The other is that the chart skips weeks. This is done for the sake of simplicity and formatting. I figured every other week was logical. The third is that athlete number one is certainly the fastest, but on some days he was not. However, he also had the fastest average. The only athlete who ever beat him in this category is athlete 9, a fellow all-state 4×400 runner. In fact, in two of the weeks sampled, athlete 9 had the fastest average, even though his best max effort was a four-way tie for second on 2.12. Other than that, his highest best effort finish was 3rd. So, what gives?
After looking at all of the data, it is impossible to say that max speed is unimportant; it most certainly is. But it is also not the only indicator of success that an athlete may have. From the chart above, a much safer conclusion would be that deviation between the average and the max is a much better indicator for success. Athletes 5, 7, and 9 all had one striking thing in common; as the season progresses, their fly 10s do not deviate much from fastest to average. In fact, their deviation drops to the .02-.03 range the more they train. Athlete 3 has seen a similar response, and his 400 has actually fallen from 58.29 to 56.69 in two weeks; from the meet on 2/17 to the meet on 3/3. Not surprisingly, both his maxes and averages have improved significantly in that span. Athlete 6 is in a similar boat. Although he is primarily a jumper, he has split 54 in the 4×400 indoors and some change in the 4×400 that placed 3rd at Illinois Top Times his sophomore year, despite less than stellar fly 10 times. The difference is that as his season progresses, he gains some maximum velocity, but he is really able to tighten up that split.
So, what about those pesky outliers, athletes 4 and 8? Athlete 4 was able to tighten things up as the season progressed, but not surprisingly, despite the 4th fastest max fly 10 time, did not have amazing debuts. This is due to the fact that his deviation has been around the .06-.08 range. This implies that as a race progresses, he loses the ability to maintain top end speed, causing deceleration and a slow down. Athlete 8 suffers the same fate. Although his maximum speed have improved greatly, his ability to hold that speed has not. His deviation has been as high as .10.
The idea behind this is simple. Often, fly 10s are a test of the alactic system. Debate on how long this system supplies energy vary, but most say this system can supply energy for around 6-15 seconds. The general idea with the alactic system is that it uses creatine phosphate to break down ATP and release energy. Some athletes will blow through this system much faster than others. This could explain a greater maximum capacity for a blazing fly 10 but why decay will happen over time to the same athlete to a greater extent.
The answer may lie in anaerobic glycolysis. The basic premise here is that oxygen is still not used, but the body breaks down ATP. This system kicks in anywhere between 10 seconds and 2 minutes, and it will vary by athlete. This is also why more successful middle distance runners can hold a faster speed for longer (but that’s a different article for a different time). If this system is developed in an athlete, they can hold faster speeds for longer periods of time. If the athlete has a moderate fly 10 but substantial capacity in this regard, they’ll be able to hold averages that do not deviate and can last through a 200 and 400 meter race much longer; hence some “slower” athletes have a better metabolic capacity than their contemporaries.
A more appropriate question is whether or not this can be trained. When I first went into “Feed the Cats” mode four years ago, I put considerable research into the subject. Anything that Chris Korfist and Tony Holler write, I read. Usually 4 times. In one of his old Inno-Sport articles, Korfist used the idea of auto-regulation. Here’s the basic premise: athletes keep running fly 10’s (or whatever the distance is) until they hit a 10% drop off. Then they’re done. Simple as that. Because we have a decent number of athletes at Pleasant Plains and math is not fun, it’s easier to simplify things a bit. If an athlete stays within .03 for either the fly 10 or the longer distance (fly 40, 40 yard dash, 50 meter dash, whatever) they keep running. If they do not, they’re done. The idea is simple; if an athlete is holding the same speed they’re able to create an adaptation that may be able to stretch out the alactic system by mere thousandths of a second. Maybe they can create the same adaptation in the anaerobic glycolytic system. The idea is when their top speed is even a fraction off, they’re done. It’s not the minimal dosage, nor the maximal that creates a perfect adaptation, but maybe it’s the right dosage. That matters. If someone has a headache the amount of Advil to take would be different for everyone. An eighth of a tablet may not produce the adaptation the body desires, but taking eight tablets would also produce a harmful result. Our athletes are not the same so they should not be treated as such. (Just note though; I’d still rather have a headache than be dead, so watch the dosage!)
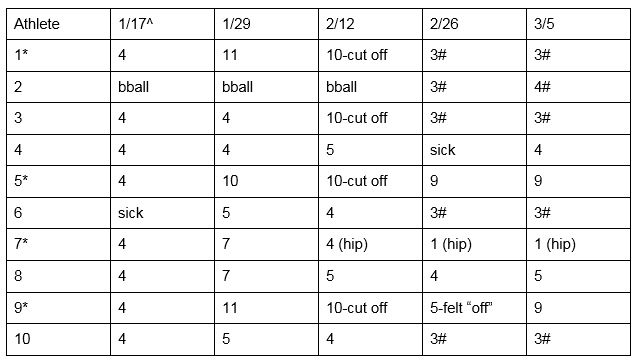
Using the same athletes, let’s look at reps until they are auto-reged out:

The trend with my faster kids is that they seem to last much longer into workouts. The kids that lack speed endurance seem to not make it as long. Athlete 9’s speed endurance is why he is able to beat athletes with more top end speed because he is able to stretch his top end speed out longer and decelerate less. Mechanics and coordination play a large factor into this as well, as does acceleration. But on average, the kids that last longer in the workout and have less deviation while doing so have a better bet on being faster. When a kid hits a big max fly-10 and cannot sustain it (the case of athlete 8) they will finish much much faster. It’s never a good idea to overkill if the body cannot sustain that; that could teach regression rather than progression, so they’re done.
To account for the added volume, sprint practices are very, very short the next day. In fact, at Plains, sprinting is only done three days a week: Monday, Wednesday, and Saturday (meets). Also, to keep from piling up unnecessary pounding, jumpers and hurdlers are cut off early on Mondays to work on approaches and hurdlers do 1-2 passes over hurdles. After all, approaches and hurdles both require sprinting, so the appropriate work is still being done and the super-compensation days are still being observed.
There’s also one more catch. At Plains, fly 10s are recorded at different distances. As the season progresses, so do the workouts. To have a complete data set, it’s responsible to collect fly 10 readings at different points in the race, and we always collect them over the last 10 meters being run for that distance. For example, on 40 yard dashes, the fly 10 is collected over the last 10 meters of that distance. Because our kids love 40s, Monday’s workout were fly 40s. I really wanted them to run 50 meters though; so we tricked them. We had them run 50 meters with a fly 40 yard dash and a fly 10 meters at the end. What I wanted was a reading on how far into a sprint my guys can hold their top end speed. If max efforts were either even to or close to their 40 yard fly 10 times I knew we were in business. If they slowed considerably I knew that they lacked sufficient speed endurance. If they improved I knew the athlete was still accelerating after 40 yards. Knowing where athletes slow down is as valuable as knowing where they’re fastest, and if this isn’t marked it’s impossible to know how to fix it. Athlete 4, for example, is a freshman who is 5’5”. He has very good top end speed; when his strength and coordination catch up to his explosiveness and when his speed endurance develops he will be very good. But right now, I know that he’s at his fastest point in a race at 40 yards rather than 50 meters like some of the other top guys. Likewise, I know that athlete 9 and 7 are still accelerating and are able to stretch out their top speed for longer. The idea with increasing this distance is trying to ever slowly increase the capacity of both the alactic and anaerobic glycolysis systems. By slowly creating this adaptation faster times in the meet sprints (100-200-400) should result.
Next week I’ll look at the role acceleration plays into this as well, and how with proper mechanics and training “slower” runners can become a smidge faster despite having max velocity deficiencies compared to their peers.
Derek DeBarr
@plainstrackxc
Head Boys Track & Field Coach
Pleasant Plains High School (IL) – enrollment 423
USATF Level-2 Certified in Jumps
Veteran of Multiple Track Football Consortiums


Very interesting! Love how you have data to back it up.