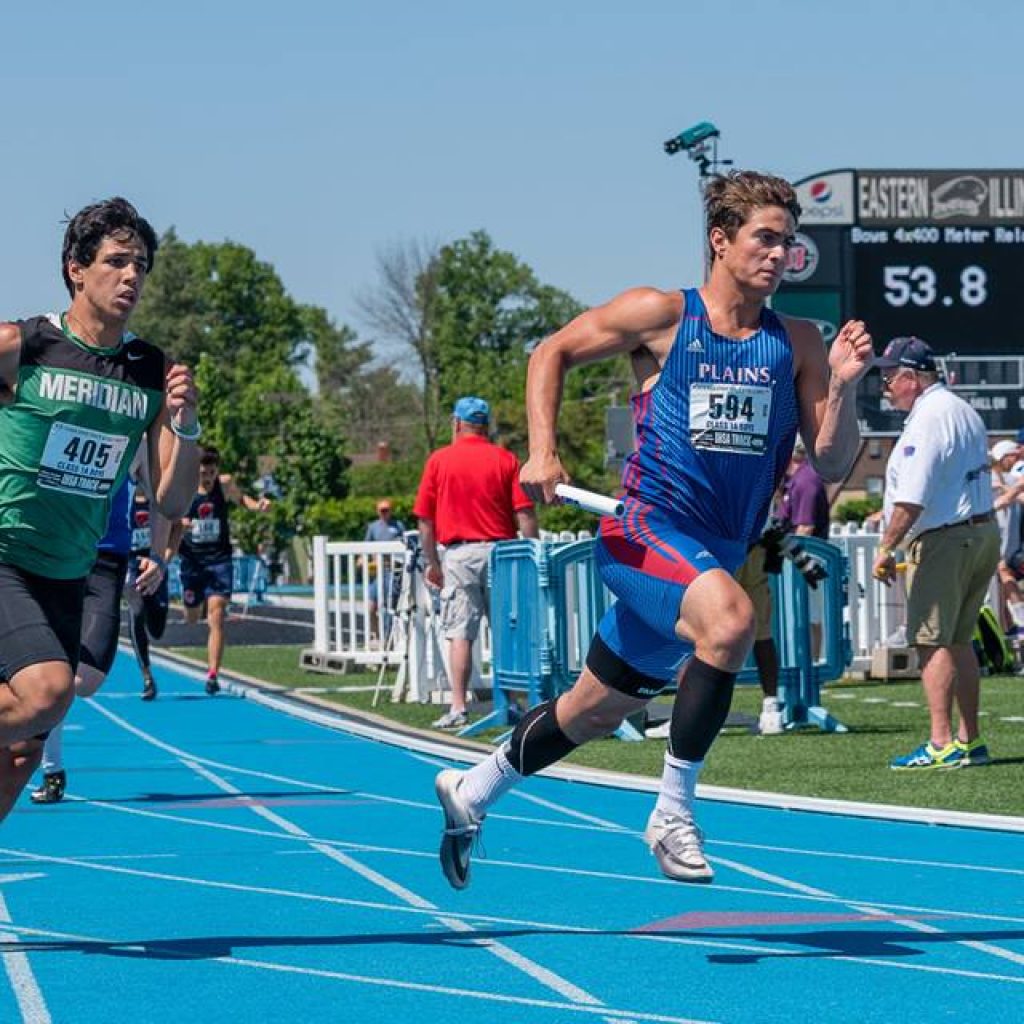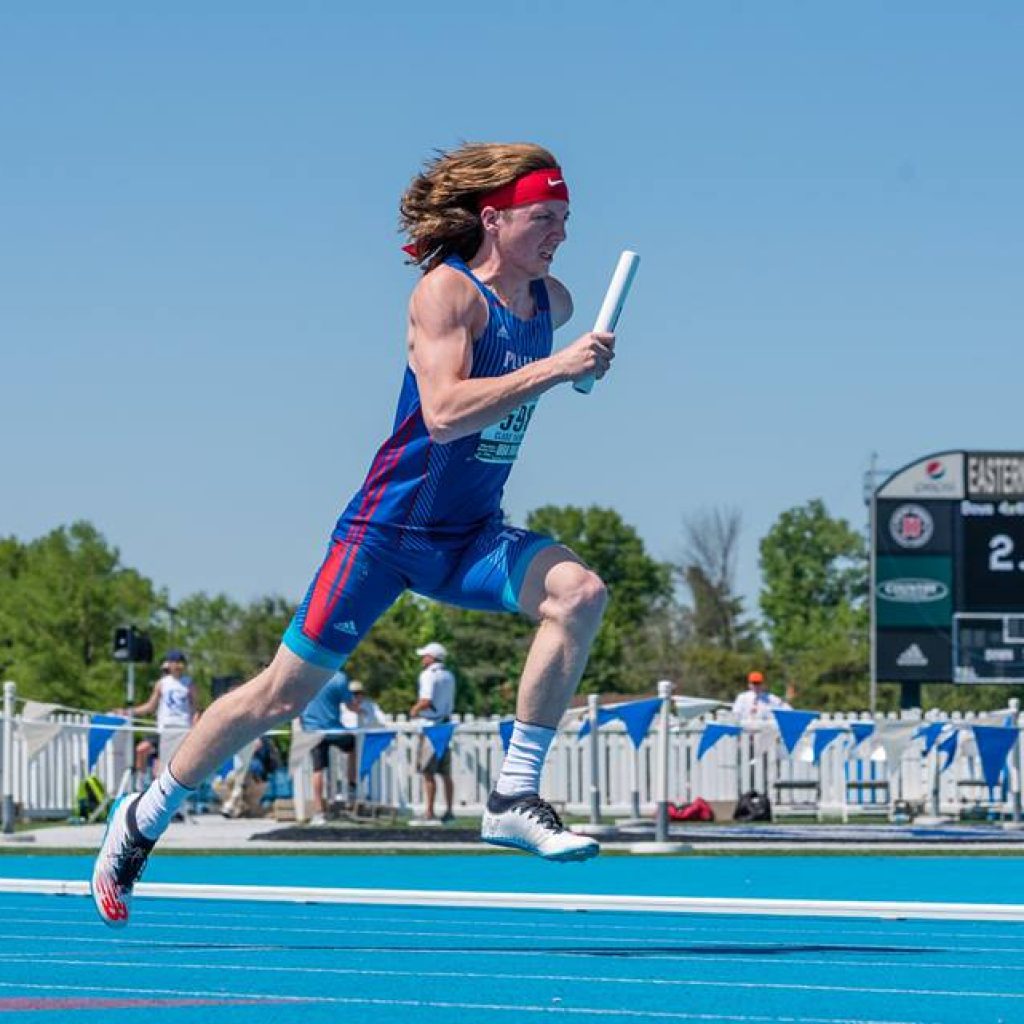
Right now is, unquestionably, the best time in history to be a track and field coach. That’s the beautiful thing about the evolution of mankind, and it’s what promotes excitement in each and every breath; right now is the best time to be alive, and every day it’s only going to get better. So it is in sprint training; the technology we have at our disposal is an undeniable arsenal of force. Our generation is able to build of the preceding one in ways that are unimaginable, and I cannot wait to see what our successors are capable of achieving.
The fly 10 has long been the staple of sprinting success, and for good reason; the faster the fly 10, the better the ceiling of an athlete. It’s also an excellent motivator for athletes to hit max velocity in workouts, and timing these sprints supplies athletes with the motivation required to bring it; after all, nobody wants to be dusted by a peer. But, WHAT IF we’re not always properly testing max velocity with our (often developing) sprinters?
When my Methods Fall Short
One of the great things about being a small high school coach is the necessity to know and understand multiple events. My specialties would lie in the fields of jumps and relays. After that, my coaching background was sketchy. Heck, even in those fields my coaching background was sketchy. I’m currently the only coach for 32 boys at Pleasant Plains. Knowing how to do 2 things won’t cut it. I’ve had to study acceleration, jumps, throws, middle distance, and distance extensively. One of my biggest takeaways from coaching longer runners is knowing what energy system to target. Just labeling a run a “tempo” run isn’t going to cut it; I need to understand what the oxidative and lactate thresholds are for exercise and how to design a specific workout to target them. Same for VO2 max, aerobic work, etc. Just labeling a workout as such doesn’t make it so; the athletes need to be constantly monitored to make sure the effort exerted properly targets the correct energy system. The same can be said for sprinting.

Awesome. So what does this have to do with sprinting?
Just because, as coaches, we state that max velocity is being targeted does not make it so. Spriting is, by definition, running at top end speed. But the funny thing about sprinting is top end speed starts to decline due to a number of factors: fatigue, coordination, improper mechanics to name a few. The truth of the matter is simple; the same fly 10 zones do not test the same thing for every athlete. If we customize workouts in the distance world with various minutes of stimulus and intensities for the endurance athlete, the same customization should work in sprinters.
Wait. That’s not practical. I only have so much time.
That is a very valid, and very fair, point. To find these various zones, a simple workout can be set up. Recently, we did a 50 meter acceleration workout and placed 5 transponders on the track, each spaced 10 meters. Each 10 meter segment was then timed. Valuable data was collected from the blocks to 10 meters (using a touchpad), from 10-20 meters, from 20-30 meters, from 30-40 meters, from 40-50 meters. In essence, each sprint was then given 6 times; the cumulative overall and 5 10 meter segments. I wanted to see where my athletes were hitting top speed and where they were slowing down. What I found was fairly consistent with my hypothesis; the athletes who had better acceleration mechanics tended to hit their fastest fly 10s in the 40-50 meter zone. The developing athletes tended to hit their fastest fly 10’s earlier in the sprint, usually from 30-40 meters. From there, there was a slow down. For example:
Athlete A’s breakdown:
| 0-10 Meters: 2.09 |
| 10- 20 Meters: 1.26 |
| 20-30 Meters: 1.21 |
| 30-30 Meters: 1.11 |
| 40-50 Meters: 1.20 |
| Total Time: 6.87 |
Athlete B’s breakdown
| 0-10 Meters: 1.98 |
| 10-20 Meters: 1.35 |
| 20-30 Meters: 1.32 |
| 30- 40 Meters: 1.20 |
| 40-50 Meters: 1.31 |
| Total Time: 7.15 |
Athlete C’s Breakdown
| 0- 10 Meters: 1.95 |
| 10-20 Meters: 1.27 |
| 20- 30 Meters: 1.15 |
| 30- 40 Meters: 1.15 |
| 40-50 Meters: 1.11 |
| Total Time: 6.62 |
Athlete A and B are promising Frosh/Soph runners, while athlete C is a senior who is a state qualifier in the 200 and has ran sub 23 FAT. The main difference in these athletes lies in their ability to accelerate continually through the sprint. From the looks of the data, athletes A and B have already hit max velocity, while athlete C may have a faster 10 meter segment in his race.
So What Does This Mean?
This data has practical implications for practice. It also dictates how long fly 10s (20s, 30s, or 40s) need to be for each runner to test their actual max velocity in practice. If we truly want to work on and test max velocity, that needs to be a different distance for each athlete. For example, we know that elite sprinters have a PcR system that can last around 8 seconds. And we know from studying Bolt’s fly 10 data that most elite sprinters can hold max velocity through 80 meters. But there’s a problem with this; I coach youth athletes of varying skill levels, not the best that have ever laced up. Their ability levels are wildly different. If we are trying to gauge our athletes’ true max speed and potential we have to measure them at different places. These places will even change throughout the season as their ability to accelerate more effectively and their strength develop. There is a place for working on decay and maintaining, but that should be on speed endurance days and lactate sessions, not on max velocity sessions.
The Remedy
To find out what each athlete needs, set up a basic sprint workout (we used 50s due to hallway length, but when we move out to the track we will be testing 70 meter sprints). We use autoreg and about 10-15 minutes between reps to find out when an athlete fatigues to the point of the workout not testing the athletes true potential. From there, find out where the athlete hits top speed, and find out how many consecutive segments the athlete can maintain about .03 from their fastest fly 10 consecutively. This will be roughly their max velocity zone. For younger athletes that zone may only last 10 meters before significant decay. Older athletes may see that zone last 30 meters. That would be each athlete’s max velocity zone. It is important to test each athlete on where their zone is, regardless of how uniform that zone is, to help with development.
Awesome. That sounds like a hot mess.
But it doesn’t have to be. For the next workout, measure out to your fastest athlete’s best fly zone. It probably won’t exceed 70 meters. At our level, 60 meters before decay may be a stretch. Since most athletes do not hit max speed before 30 meters, place one transponder every 10 meters from 30-70 meters. From there, have athletes who aren’t running or just finishing move a set of orange stop cones to denote each athletes finish time. Each time an athlete runs, simple write down their fly 10 splits in the spreadsheet and have it do the math for you, like you can find here. (click on the 2/25 tab)
If blocks are not being used another method that can be tested is to place a 10 meter fly zone on the track, but place corresponding blue tape marks on the track every 10 meters. Then simply tell each athlete what piece of tape to start at. That way the same consistent measurement can be used, but each athlete is in the appropriate max velocity zone as well. More developed sprinters with good acceleration mechanics start further back, while less developed sprinters start closer to the zone.

This way, we can be sure that we are testing exactly what the workout is written for and giving each athlete the appropriate stimulus that they need, but making practice simple enough to administer in mass. Then, we can save the mechanics in decay for workouts that target this skill, like speed endurance or lactate workouts, and we can stay in the proper training lanes.
The use of technology in our sport is growing, and this is for the better. As coaches we have to adapt with the times and use this technology to create workouts that are sure to properly stress and test the energy system that correlates best with the workout. From there, we can target exactly where an athlete hits top speed, keep the athlete in this zone for as long as necessary, then slowly start to expand this speed zone as an athlete’s strength and coordination improves. What this looks like for each athlete is different, but with some time and care each workout can be altered to make sure each athlete on the team gets what he or she needs.
Derek DeBarr
Pleasant Plains Track Coach


Sonofagun, can I come run for you? Oh, 77 is too old? Too bad, I would LOVE to train with any of you Track Football Consortium guys who make it fun. And who’ve proved that speed, fun and success go together like Carl Lewis and sub-9 100’s.
Oops, did I say sub-9? Long day.